Introduction to Statistical Trading
Mean-Reversion: A Statistical Approach to Market Inefficiencies
Mean-reversion trading exploits a fundamental statistical property of financial markets: prices that deviate significantly from their statistical mean tend to return to that mean over time. This phenomenon occurs due to measurable distributional characteristics in market returns that differ substantially from theoretical models.
The Normal Distribution Assumption Problem
Traditional finance theory assumes market returns follow a normal distribution with these characteristics:
- Standard deviation captures all risk
- Extreme events follow predictable probabilities
- Returns are independent and identically distributed
Empirical analysis reveals these assumptions are systematically violated in real markets.
Empirical Evidence: NASDAQ-100 Return Distribution
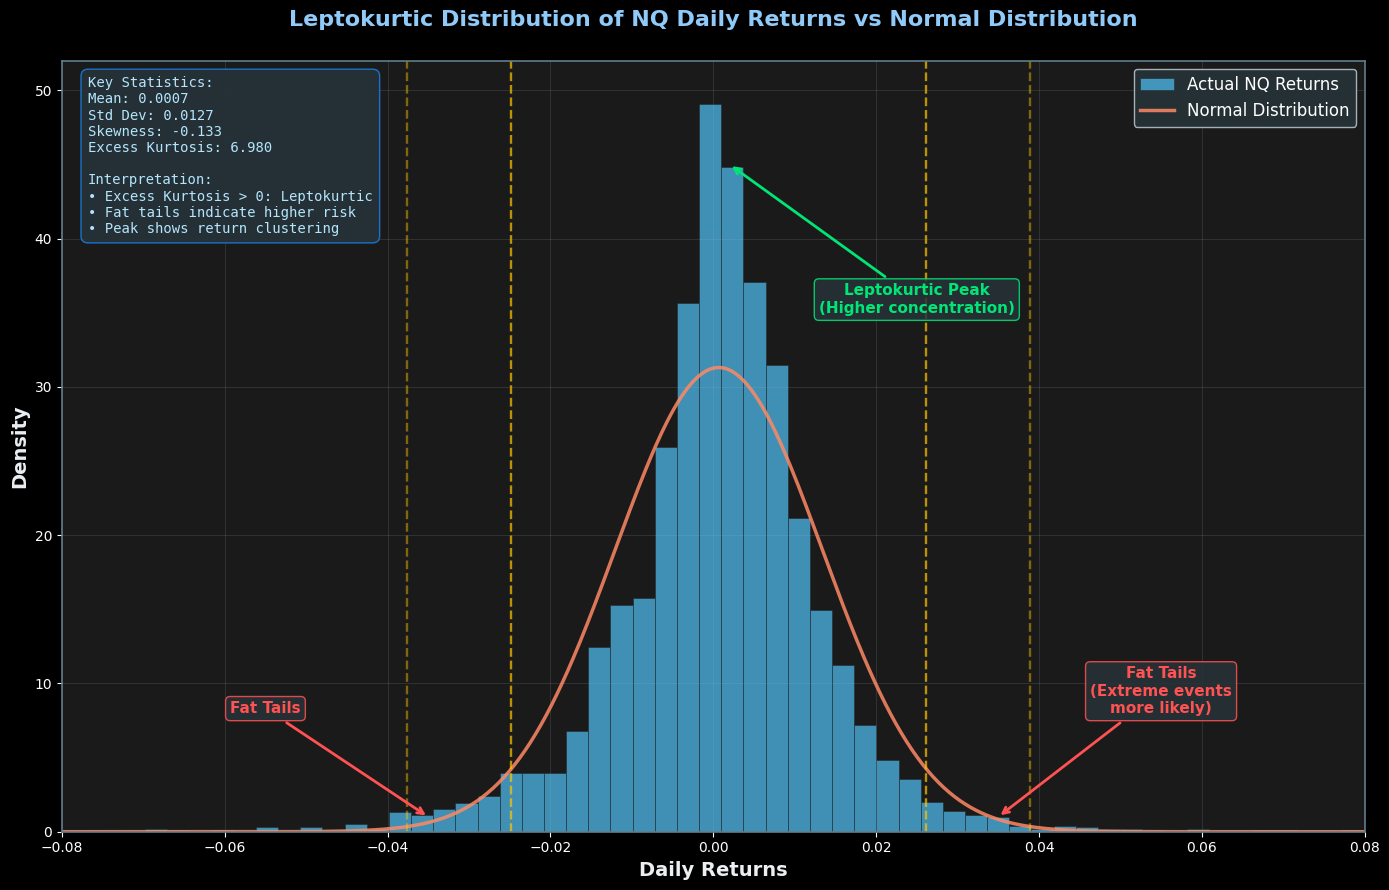
This histogram shows actual NASDAQ-100 daily returns (blue bars) versus the theoretical normal distribution (orange curve). Key observations:
Statistical Deviations:
- Excess Kurtosis: The distribution exhibits a significantly higher peak than normal
- Fat Tails: Extreme price movements occur with much higher frequency than predicted
- Asymmetric Clustering: Returns cluster around the mean more than theory suggests
Quantitative Implications:
- Large price moves (>2 standard deviations) happen approximately 3-5x more often than normal distribution predicts
- Small daily changes occur with 20-30% higher frequency than expected
- This creates systematic opportunities for mean-reversion strategies
Monte Carlo Simulation: Price Path Analysis
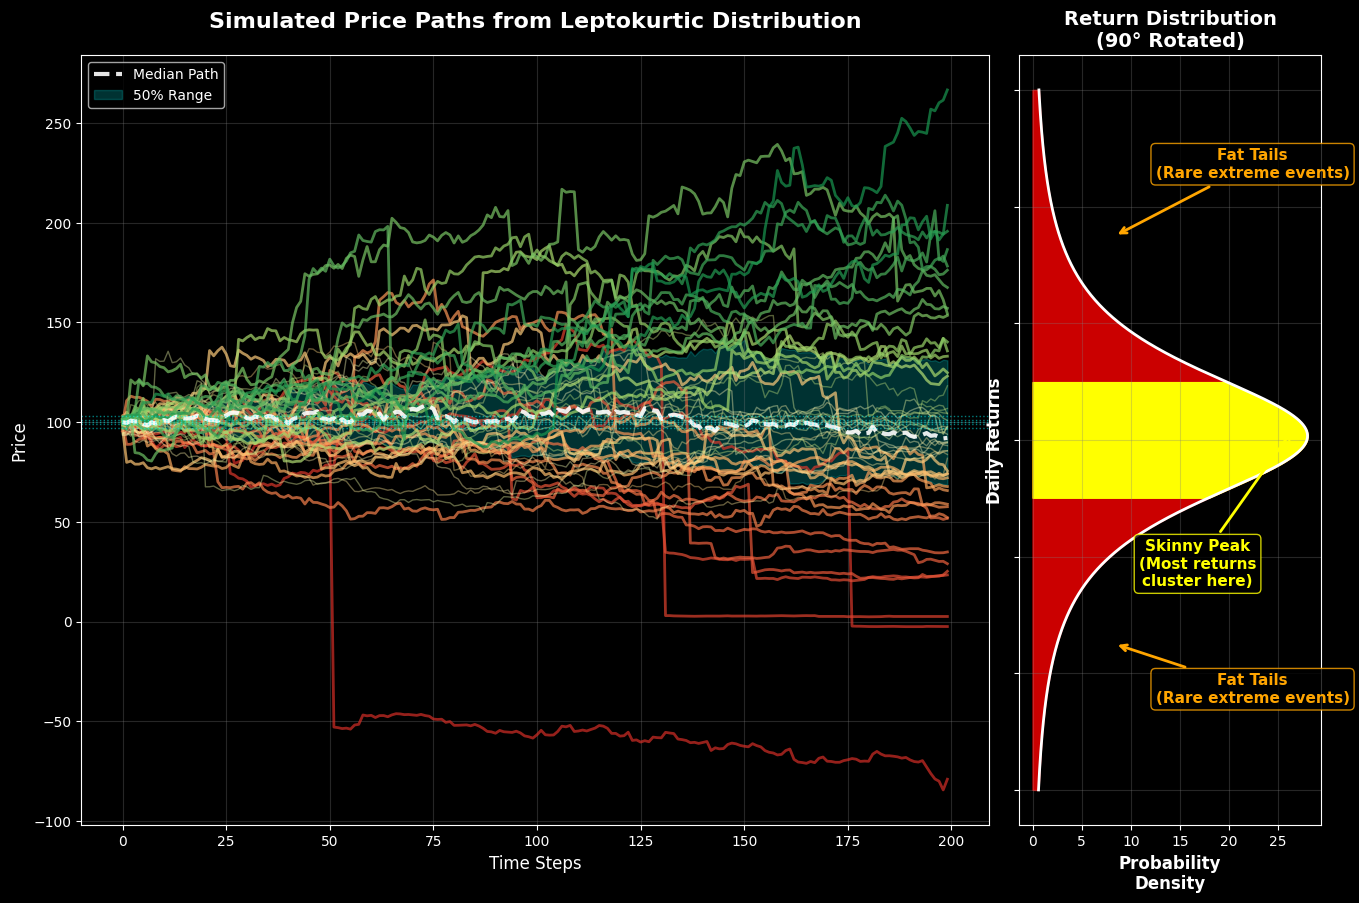
This simulation generates 200 price paths using empirically-derived return distributions. The analysis reveals:
Path Behavior Analysis:
- Divergent Paths: Some trajectories experience significant upward (green) or downward (red) movements
- Reversion Patterns: A substantial portion of paths (yellow/orange) demonstrate mean-reversion behavior
- Statistical Convergence: Over extended periods, prices show tendency to revert toward initial levels
Distribution Characteristics:
- The right panel confirms the leptokurtic (peaked) nature of return distributions
- This shape creates the statistical foundation for mean-reversion profitability
Random Walk Theory vs. Empirical Reality
The Efficient Market Hypothesis suggests price movements follow a random walk with normal distribution characteristics. However, empirical data consistently shows:
- Volatility Clustering: High volatility periods cluster together
- Serial Correlation: Returns exhibit measurable autocorrelation patterns
- Non-Normal Distributions: Persistent excess kurtosis and skewness
These deviations from randomness create exploitable statistical patterns.
Application: Premium/Discount Framework
The statistical properties observed enable a systematic approach to identifying trading opportunities:
Fair Value Determination:
- Premium Zone: Price trading above statistical mean with high probability of reversion
- Discount Zone: Price trading below statistical mean with reversion potential
- Fair Value: The statistical equilibrium level derived from historical price action
Institutional Application: Professional traders utilize this framework by:
- Identifying extreme deviations from statistical norms
- Calculating probability-weighted expected returns
- Implementing systematic position sizing based on statistical confidence levels
Consolidation Trading Logic:
- Range-bound markets clearly define statistical boundaries
- The leptokurtic distribution ensures higher probability of price remaining near the mean
- Breakouts often represent temporary overshoots that create new mean-reversion opportunities
Statistical Edge: Market returns exhibit consistent deviations from normal distribution assumptions. These measurable statistical properties create systematic opportunities for traders who understand and can quantify these market inefficiencies.